Introduction
Condor AI builds real-world intelligence systems by combining computer vision models, edge devices, and scalable software to help teams monitor and manage complex environments across smart cities, industrial automation, and fleet operations.
Role
User research, wireframes, prototype
Team
1 Designer (me)
Project type
Concept
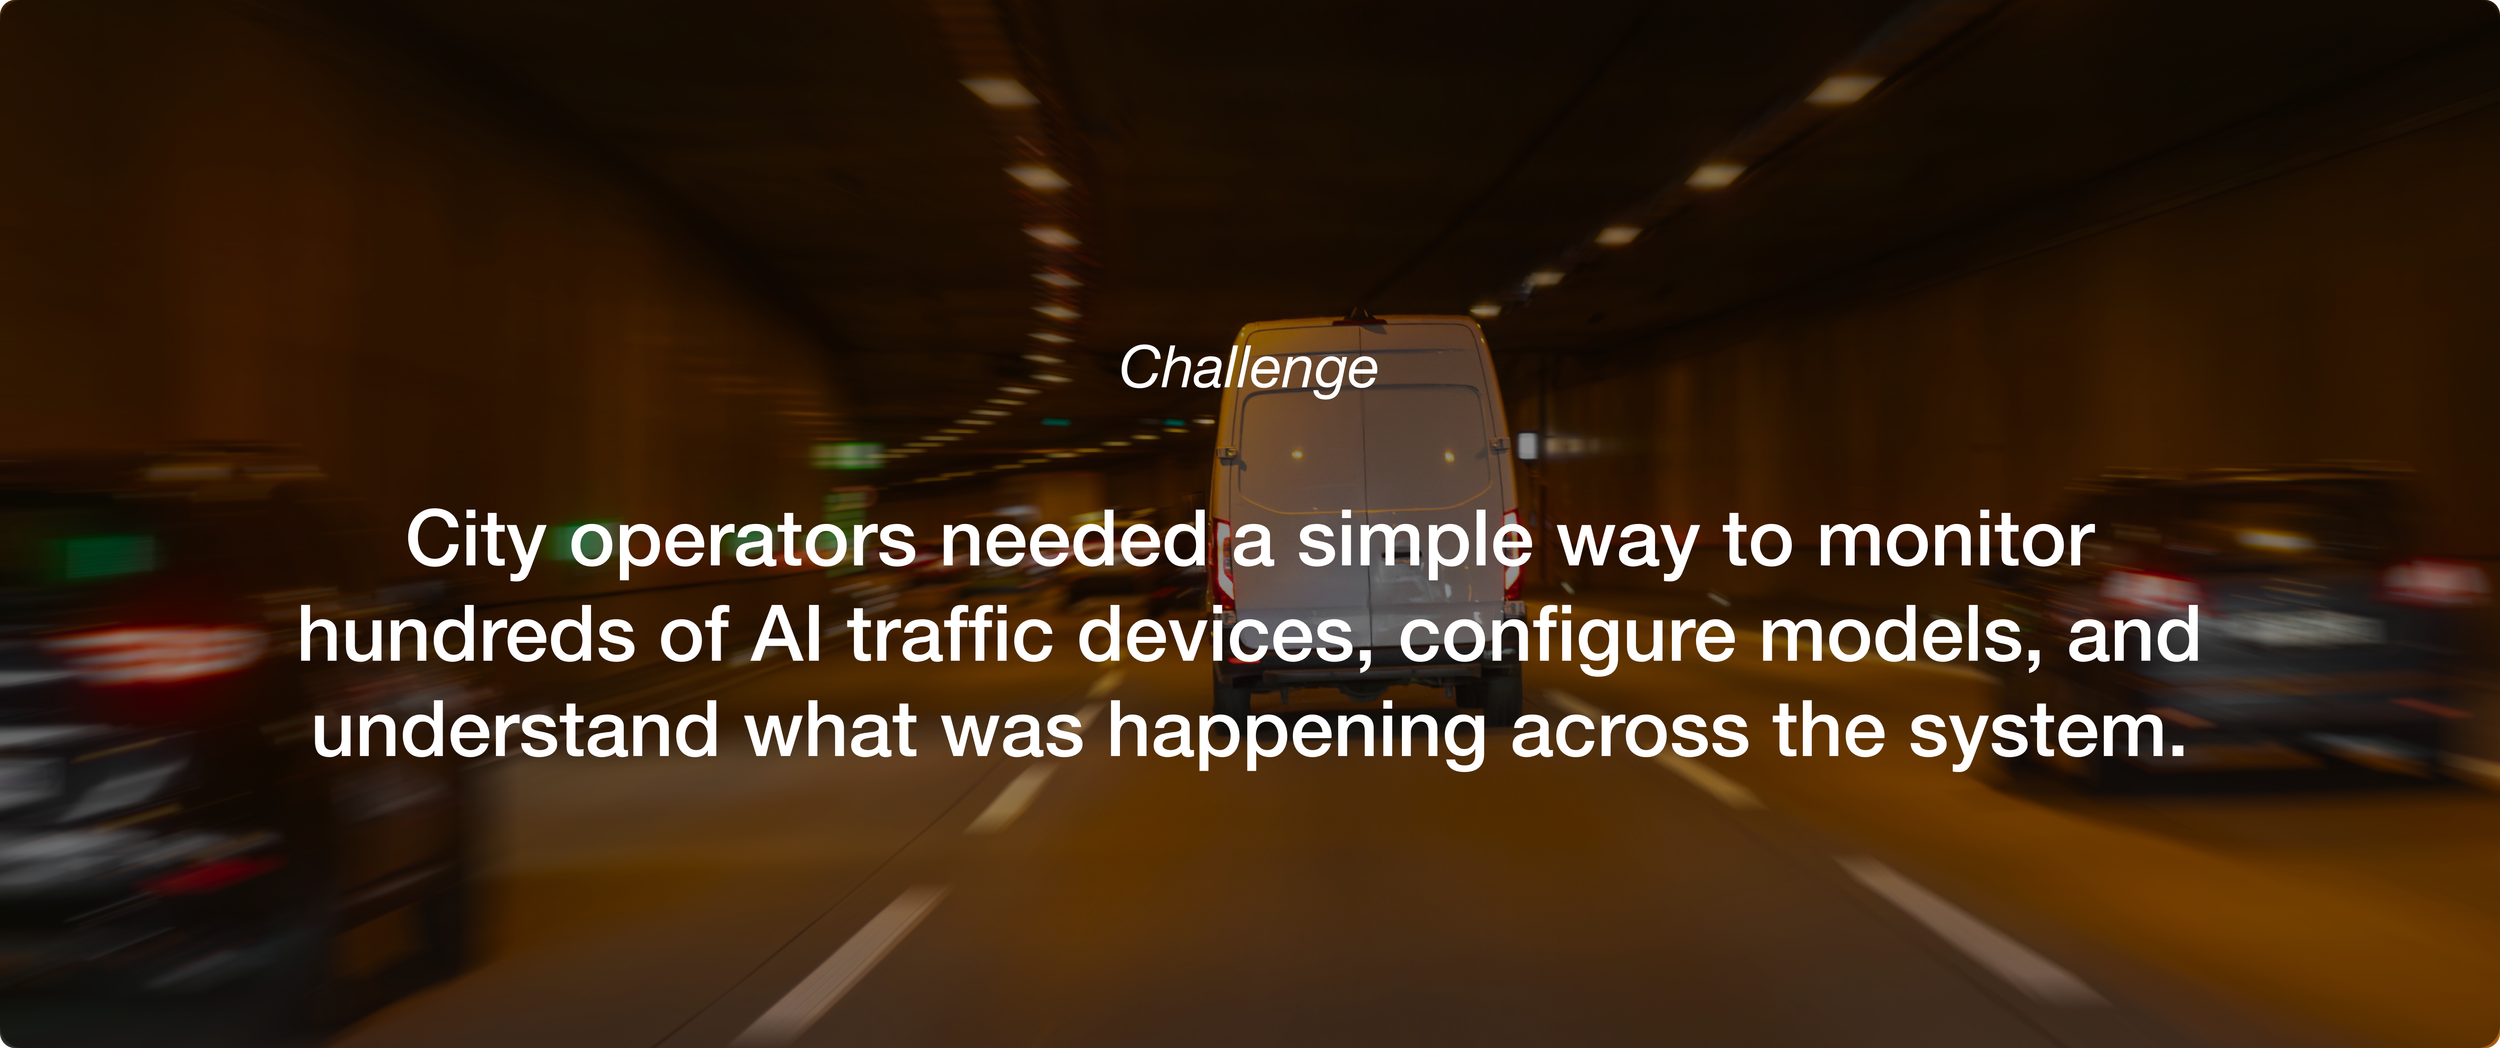
Problem
Background
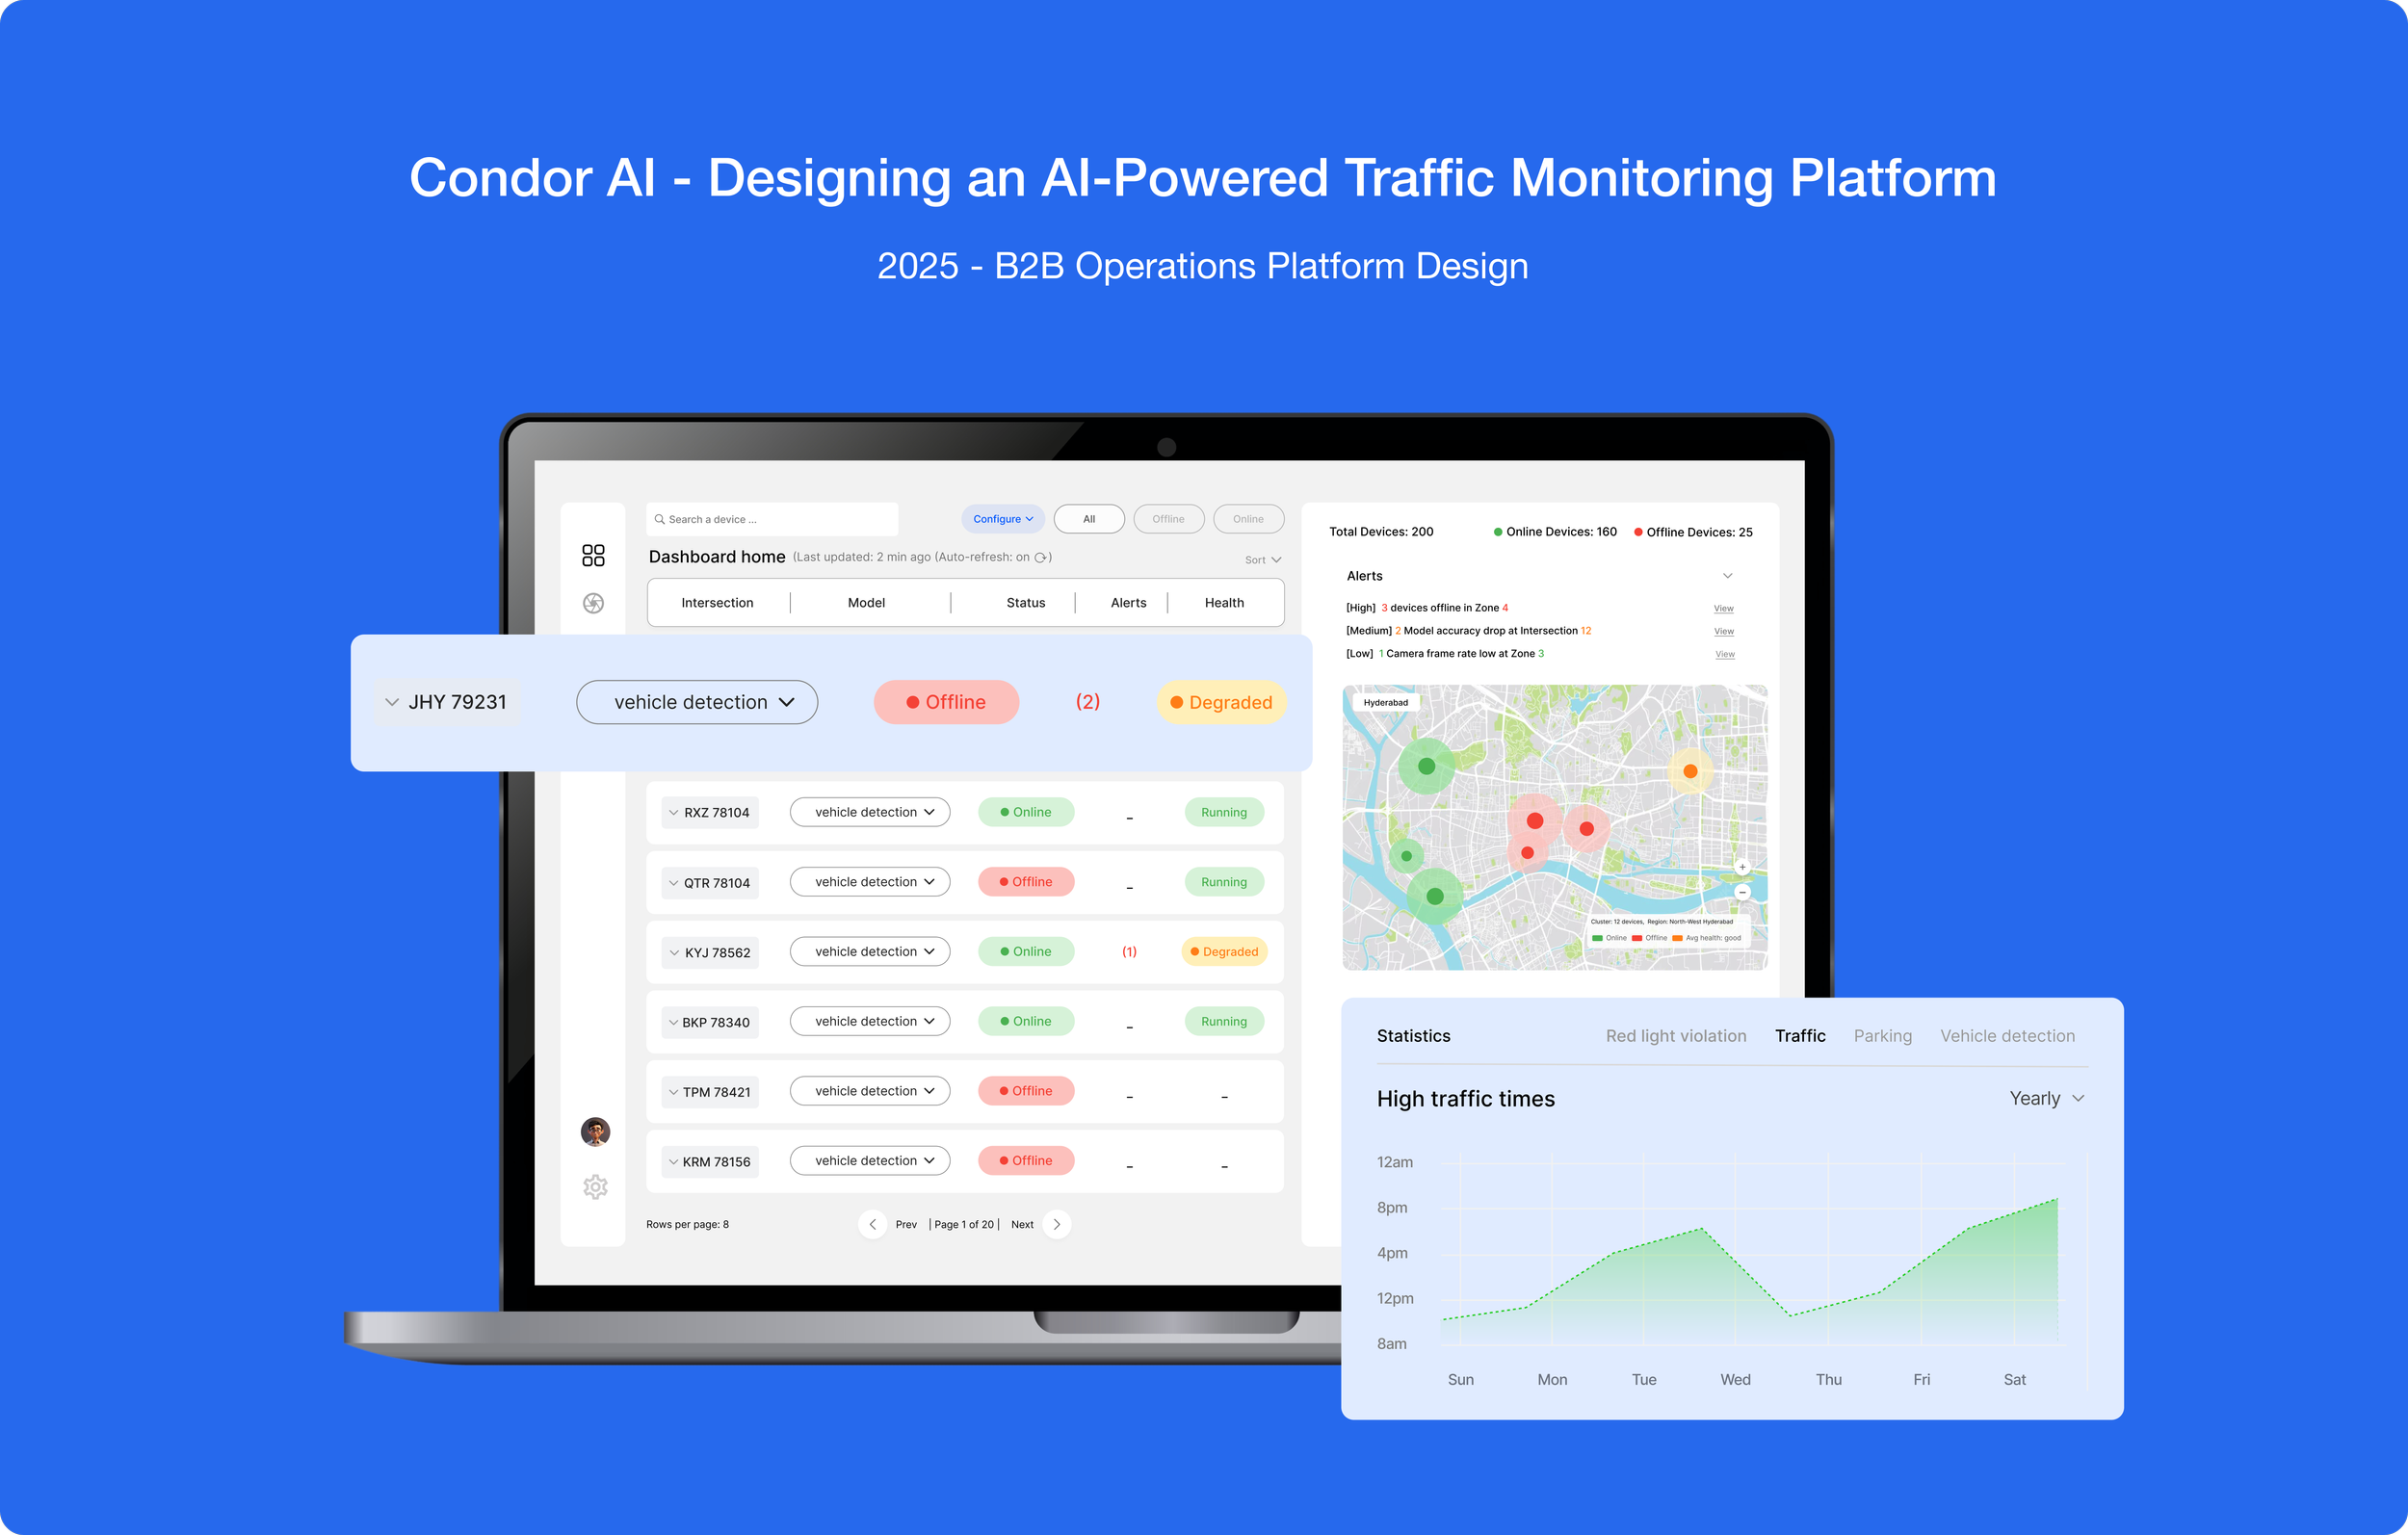
This project designs a web platform to manage AI vision devices across 200+ city intersections. Each smart camera runs edge AI models and connects to a cloud dashboard. The goal was to create a high-level monitoring dashboard and a detailed configuration screen for assigning, tuning, and updating AI models while tracking performance and events.
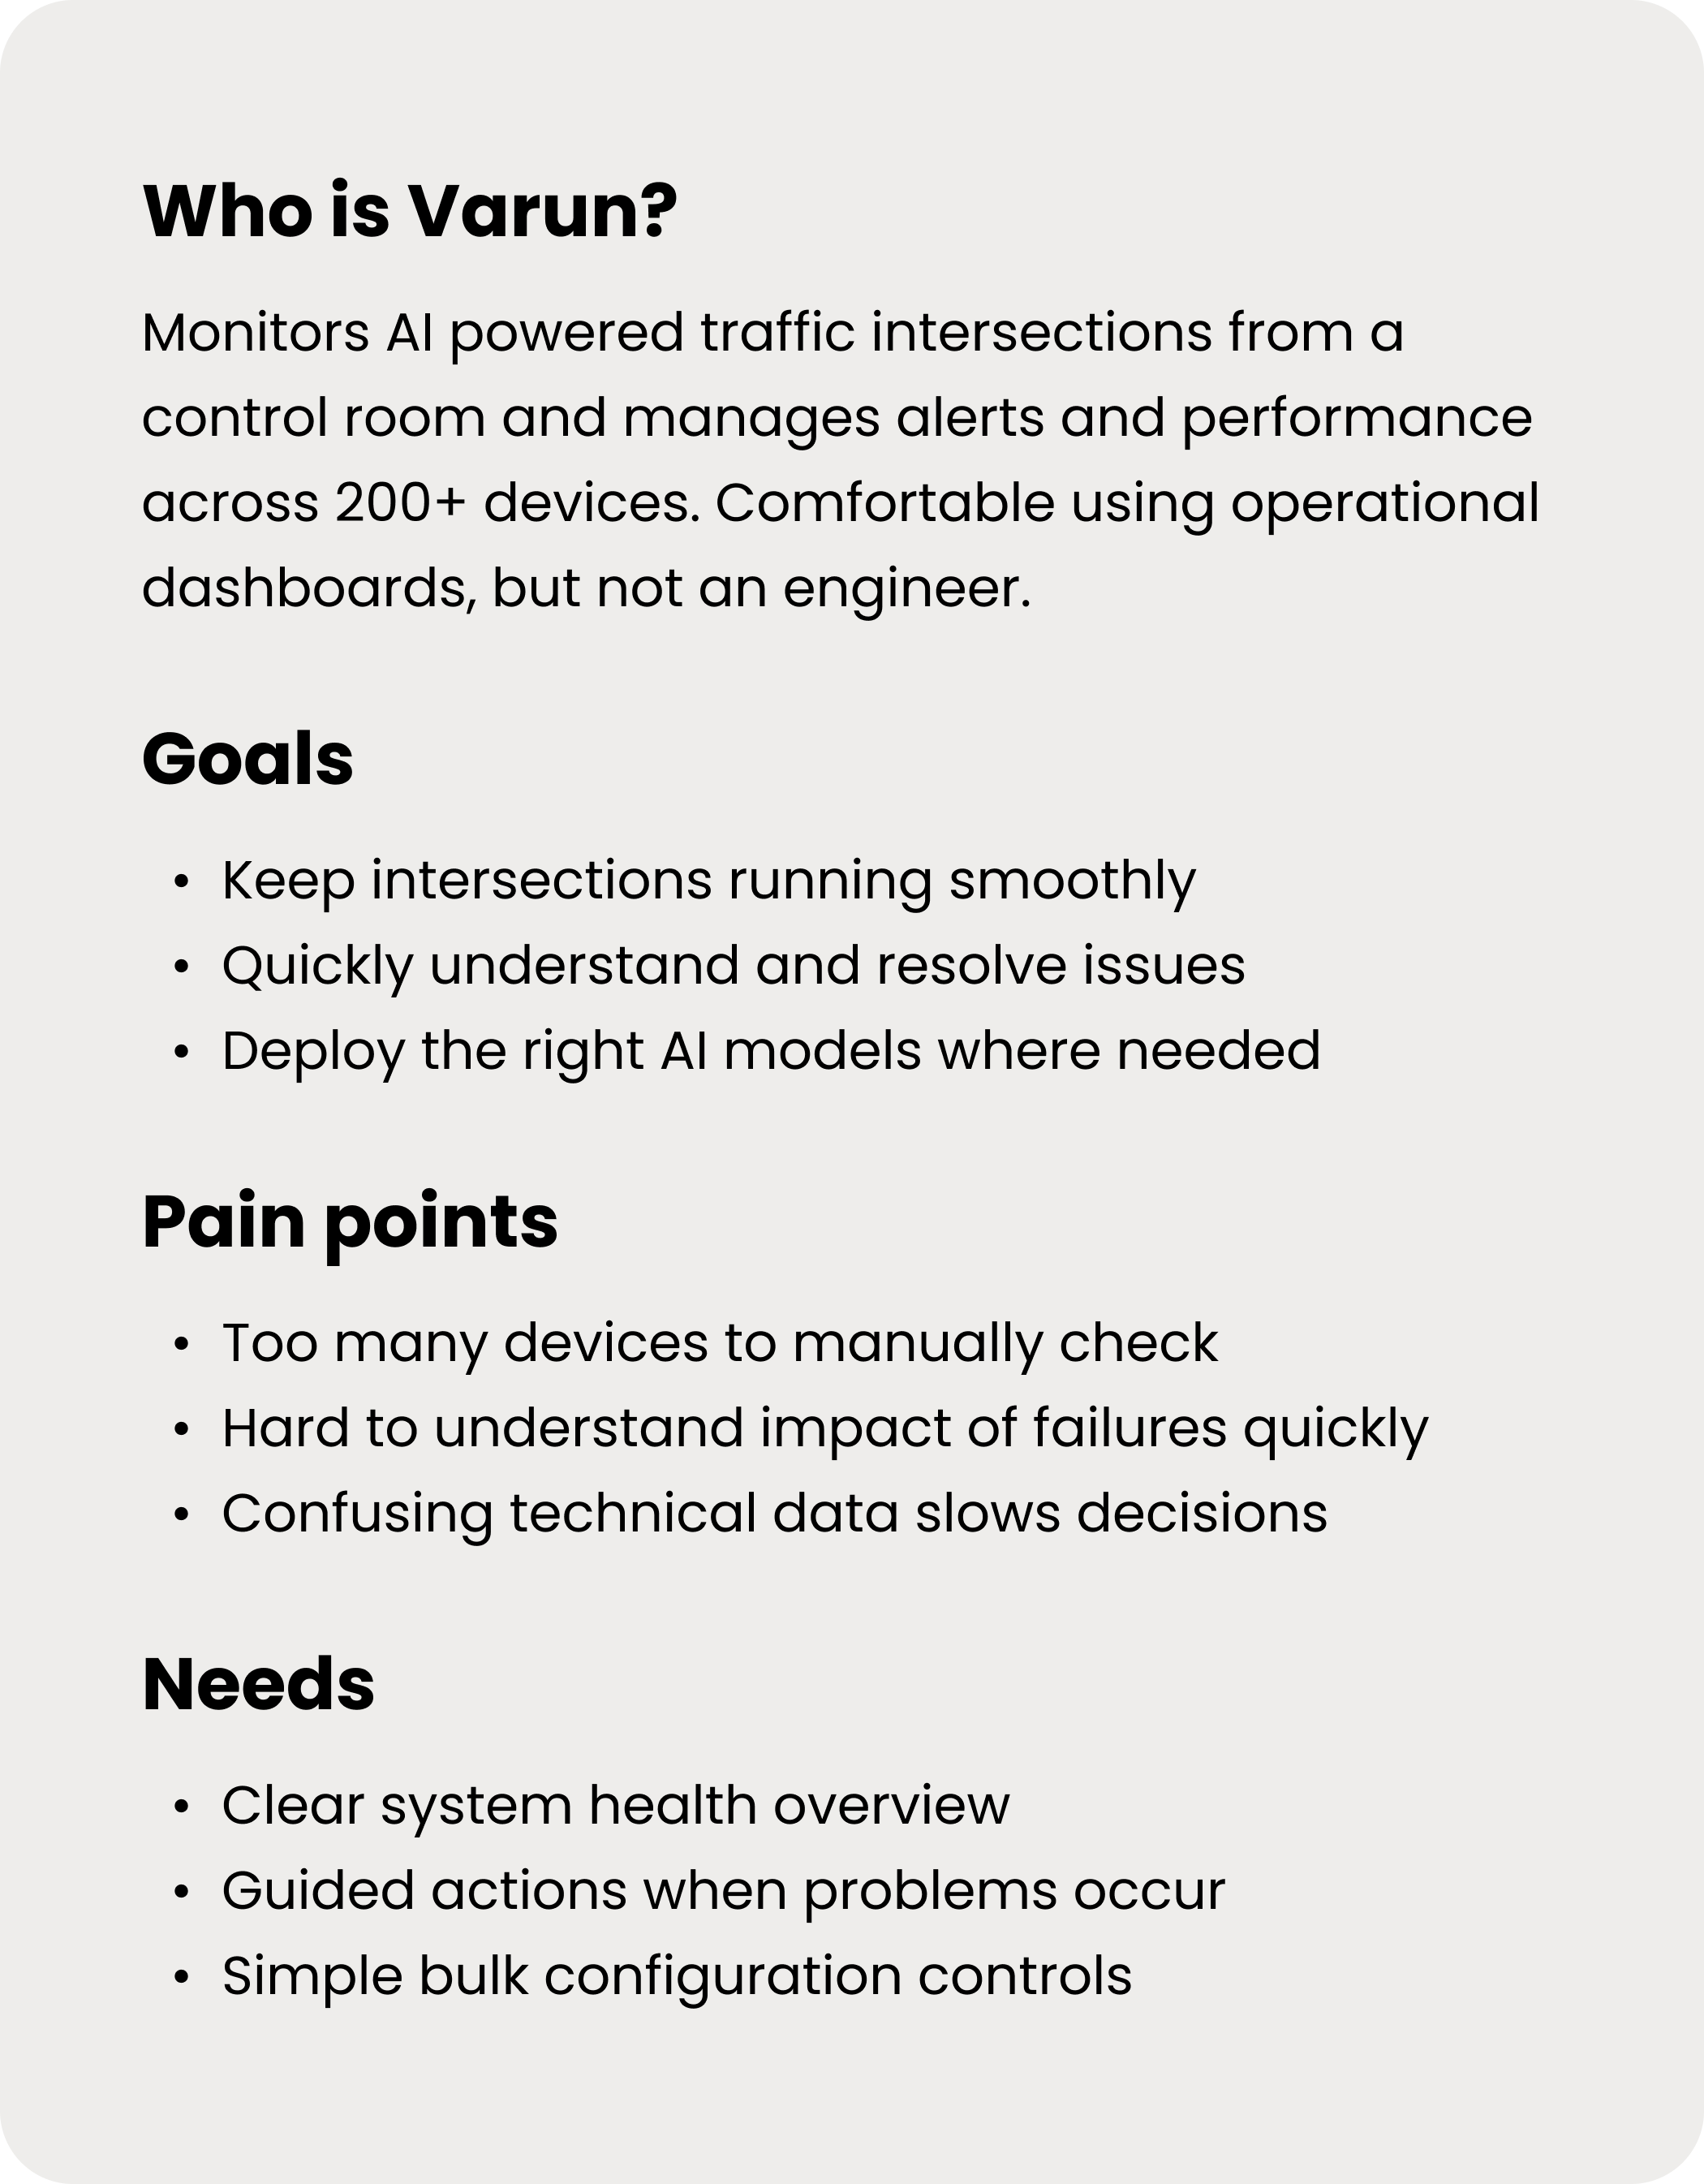
Primary User
Managing city traffic shouldn’t feel like debugging software.

Process
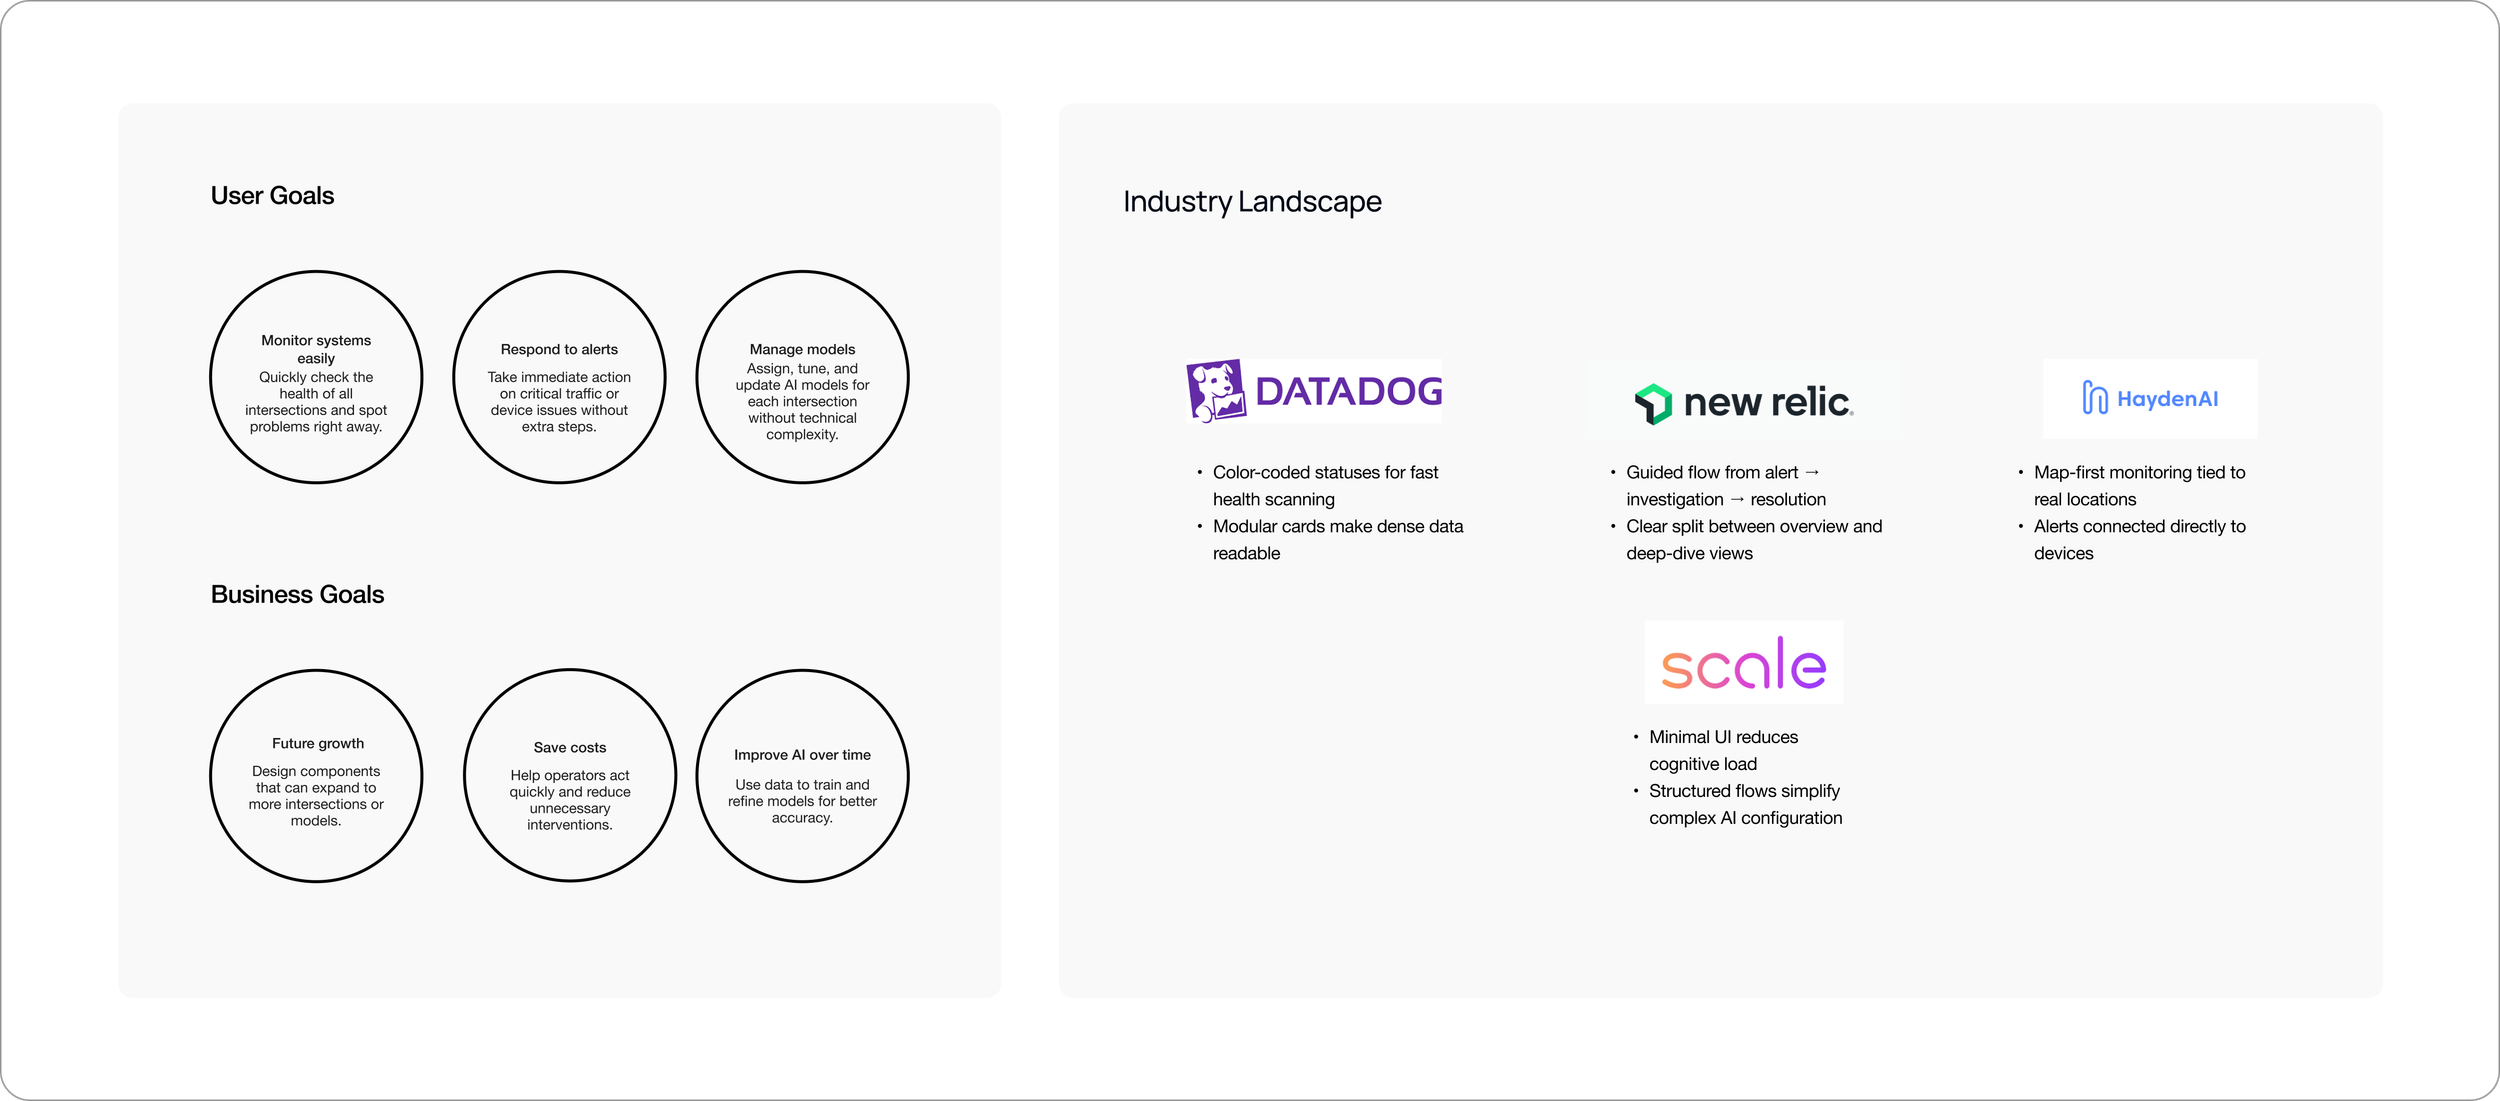
Research
The industry landscape was reviewed to understand common monitoring workflows and interaction patterns. This helped define user goals (monitor, respond, manage models) and business goals (scale, reduce cost, improve AI performance)
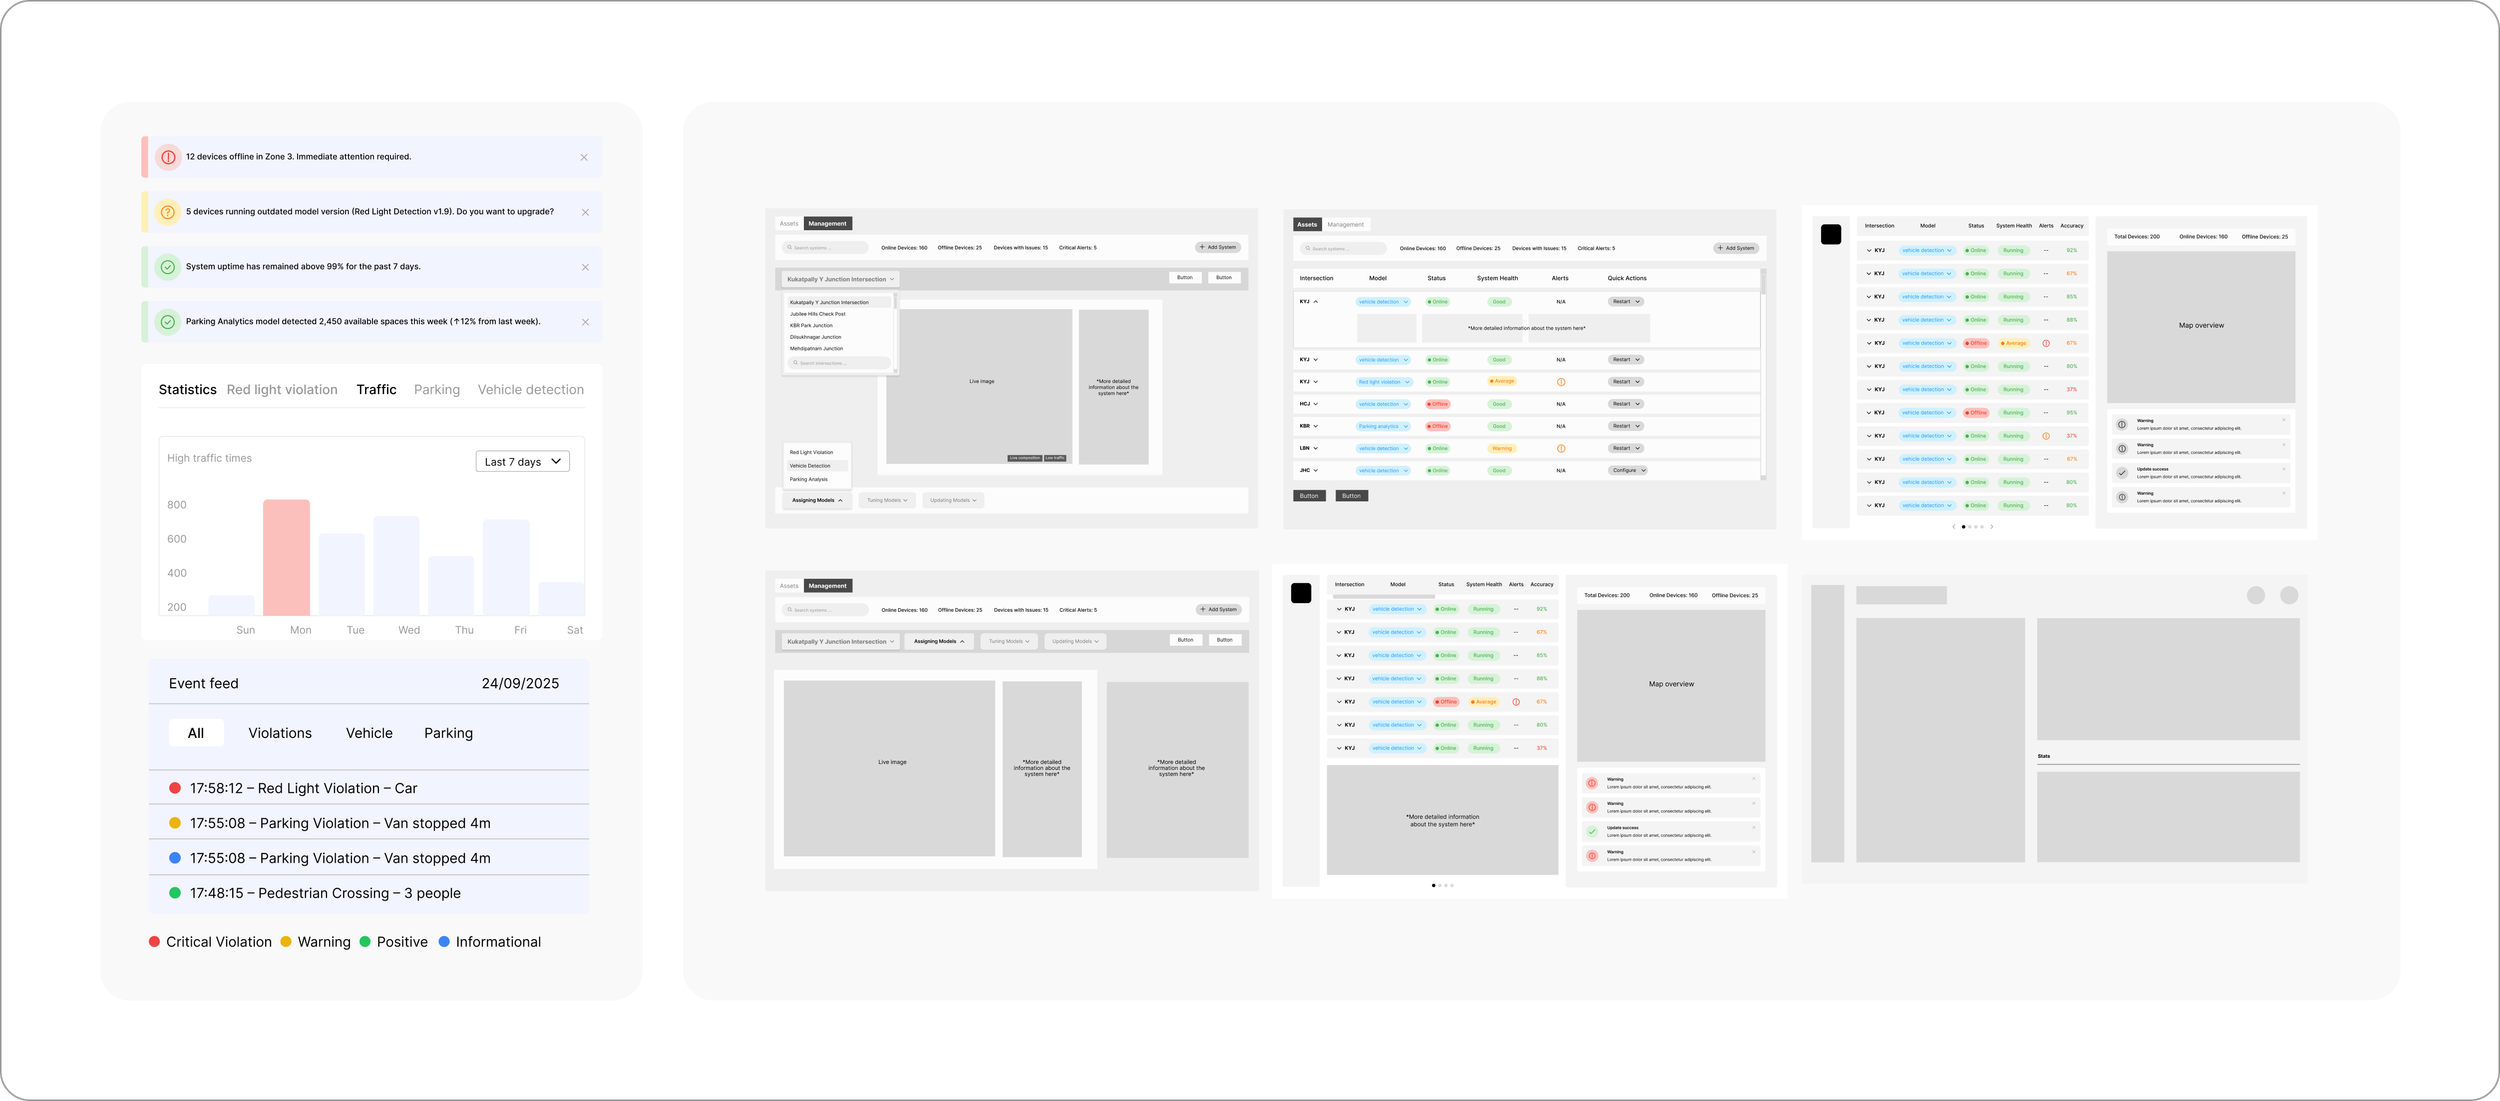
Alternative's of the wireframe
Opportunity Area
Make bulk actions feel deliberate than risky
Improve how alerts guide users from awareness to resolution
Reduce cognitive load while monitoring system health
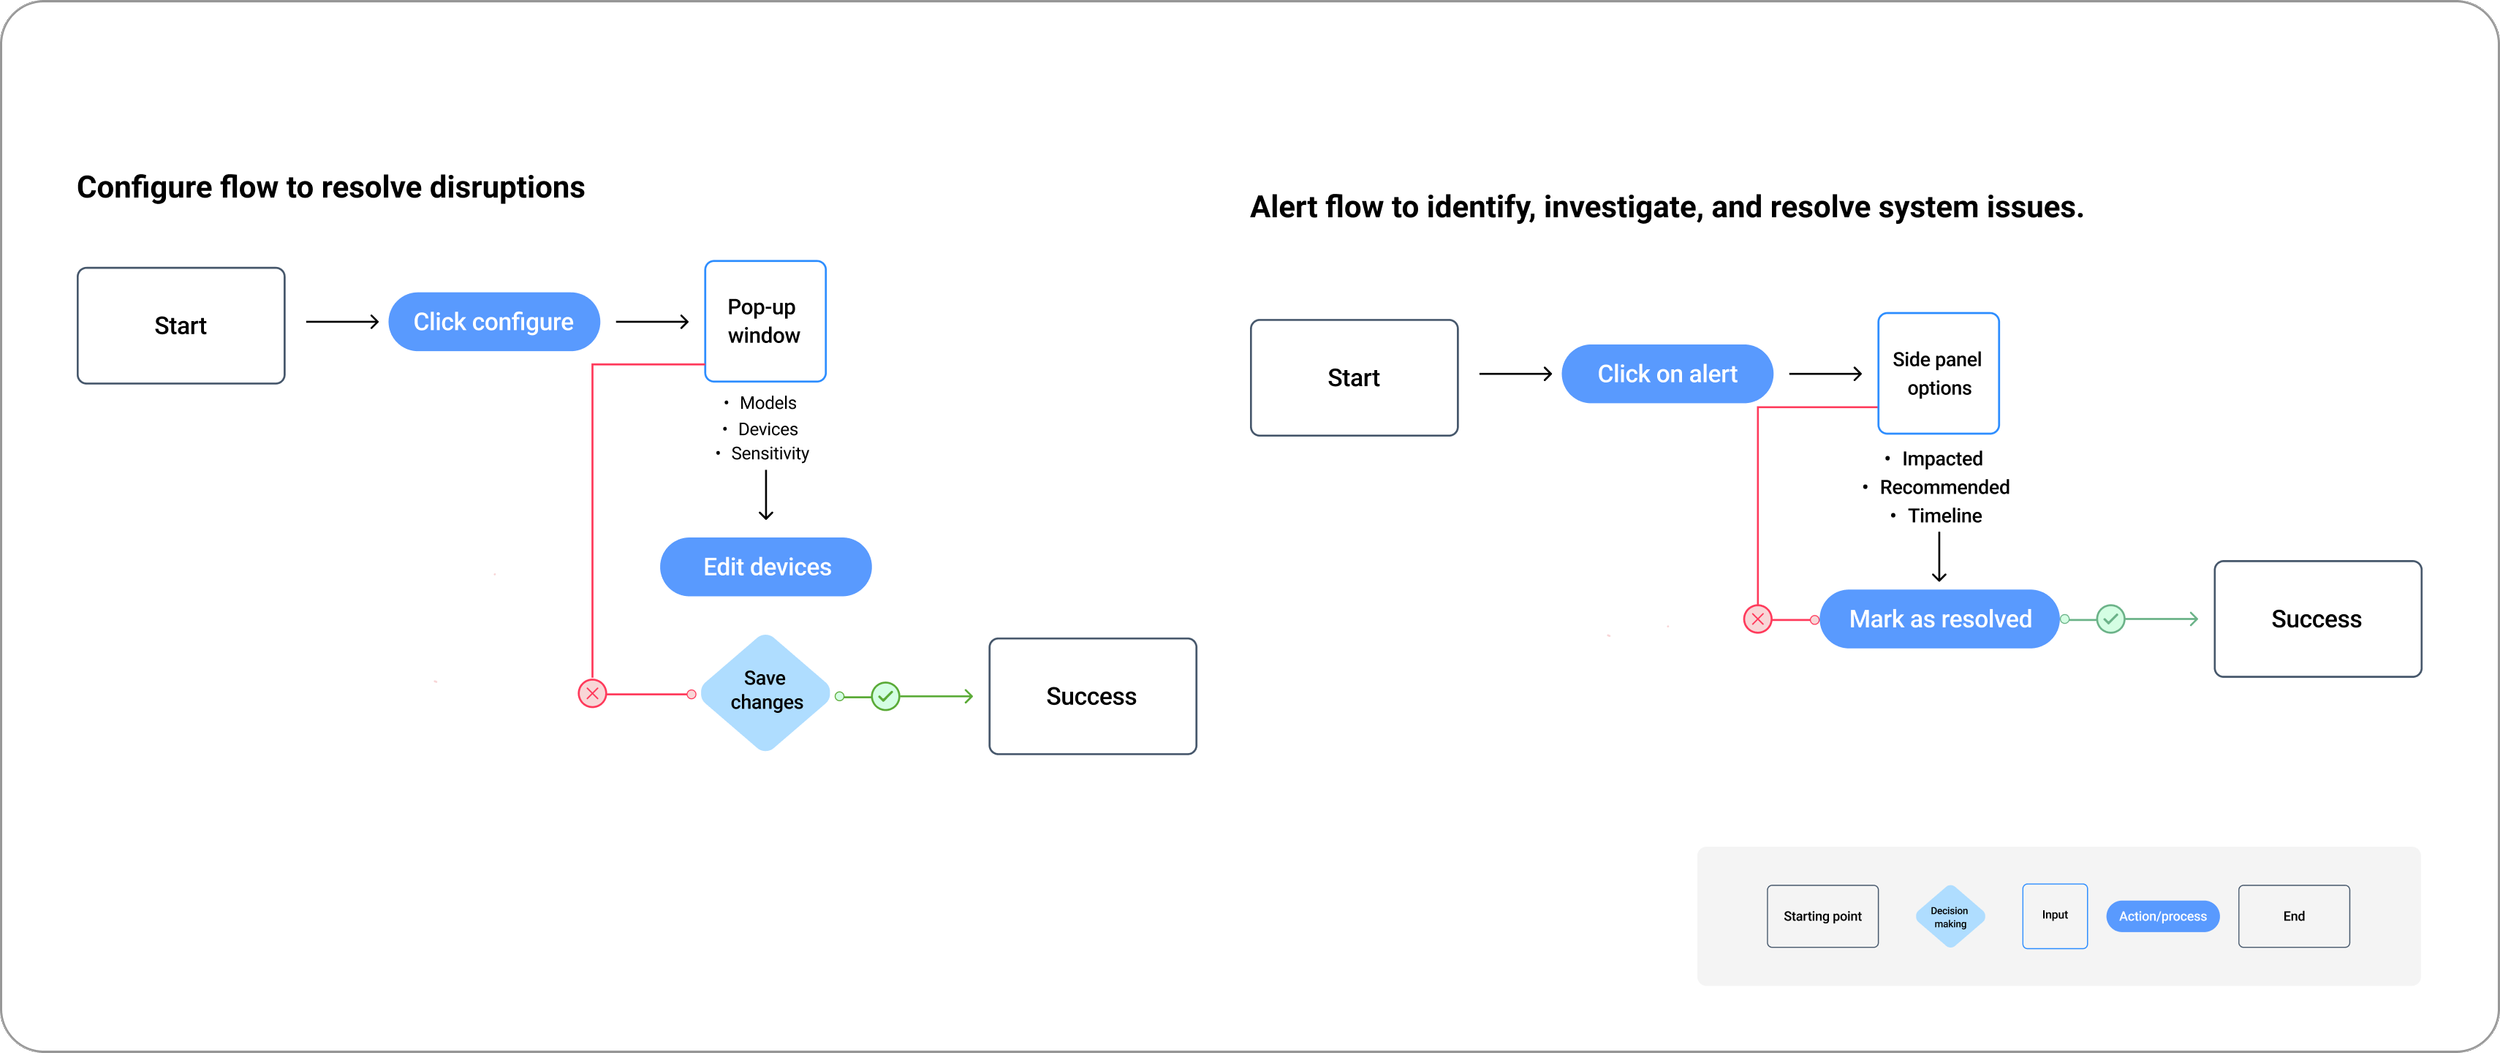
Key task flows
These flows illustrate how operators monitor system health, respond to incidents, and safely configure AI models at city scale
Outcome
Opportunity 1: Make bulk actions feel deliberate than risky
Monitor deployment status (live/offline devices, alerts.)
Configure and assign AI models to selected devices
The dashboard provides a clear overview of system health across all devices, with a map highlighting areas with the most alerts to help operators act quickly. Complex data is simplified through visual hierarchy and color, making it easier to scan, understand, and take action at a glance.
Map view to show device health and issues across different regions.
Alerts requiring attention
Opportunity 2: Improve how operators understand and act on device health
The screen reduces mental effort by visualizing system behavior directly through live footage, model status, and categorized events, though further hierarchy could strengthen at-a-glance monitoring.
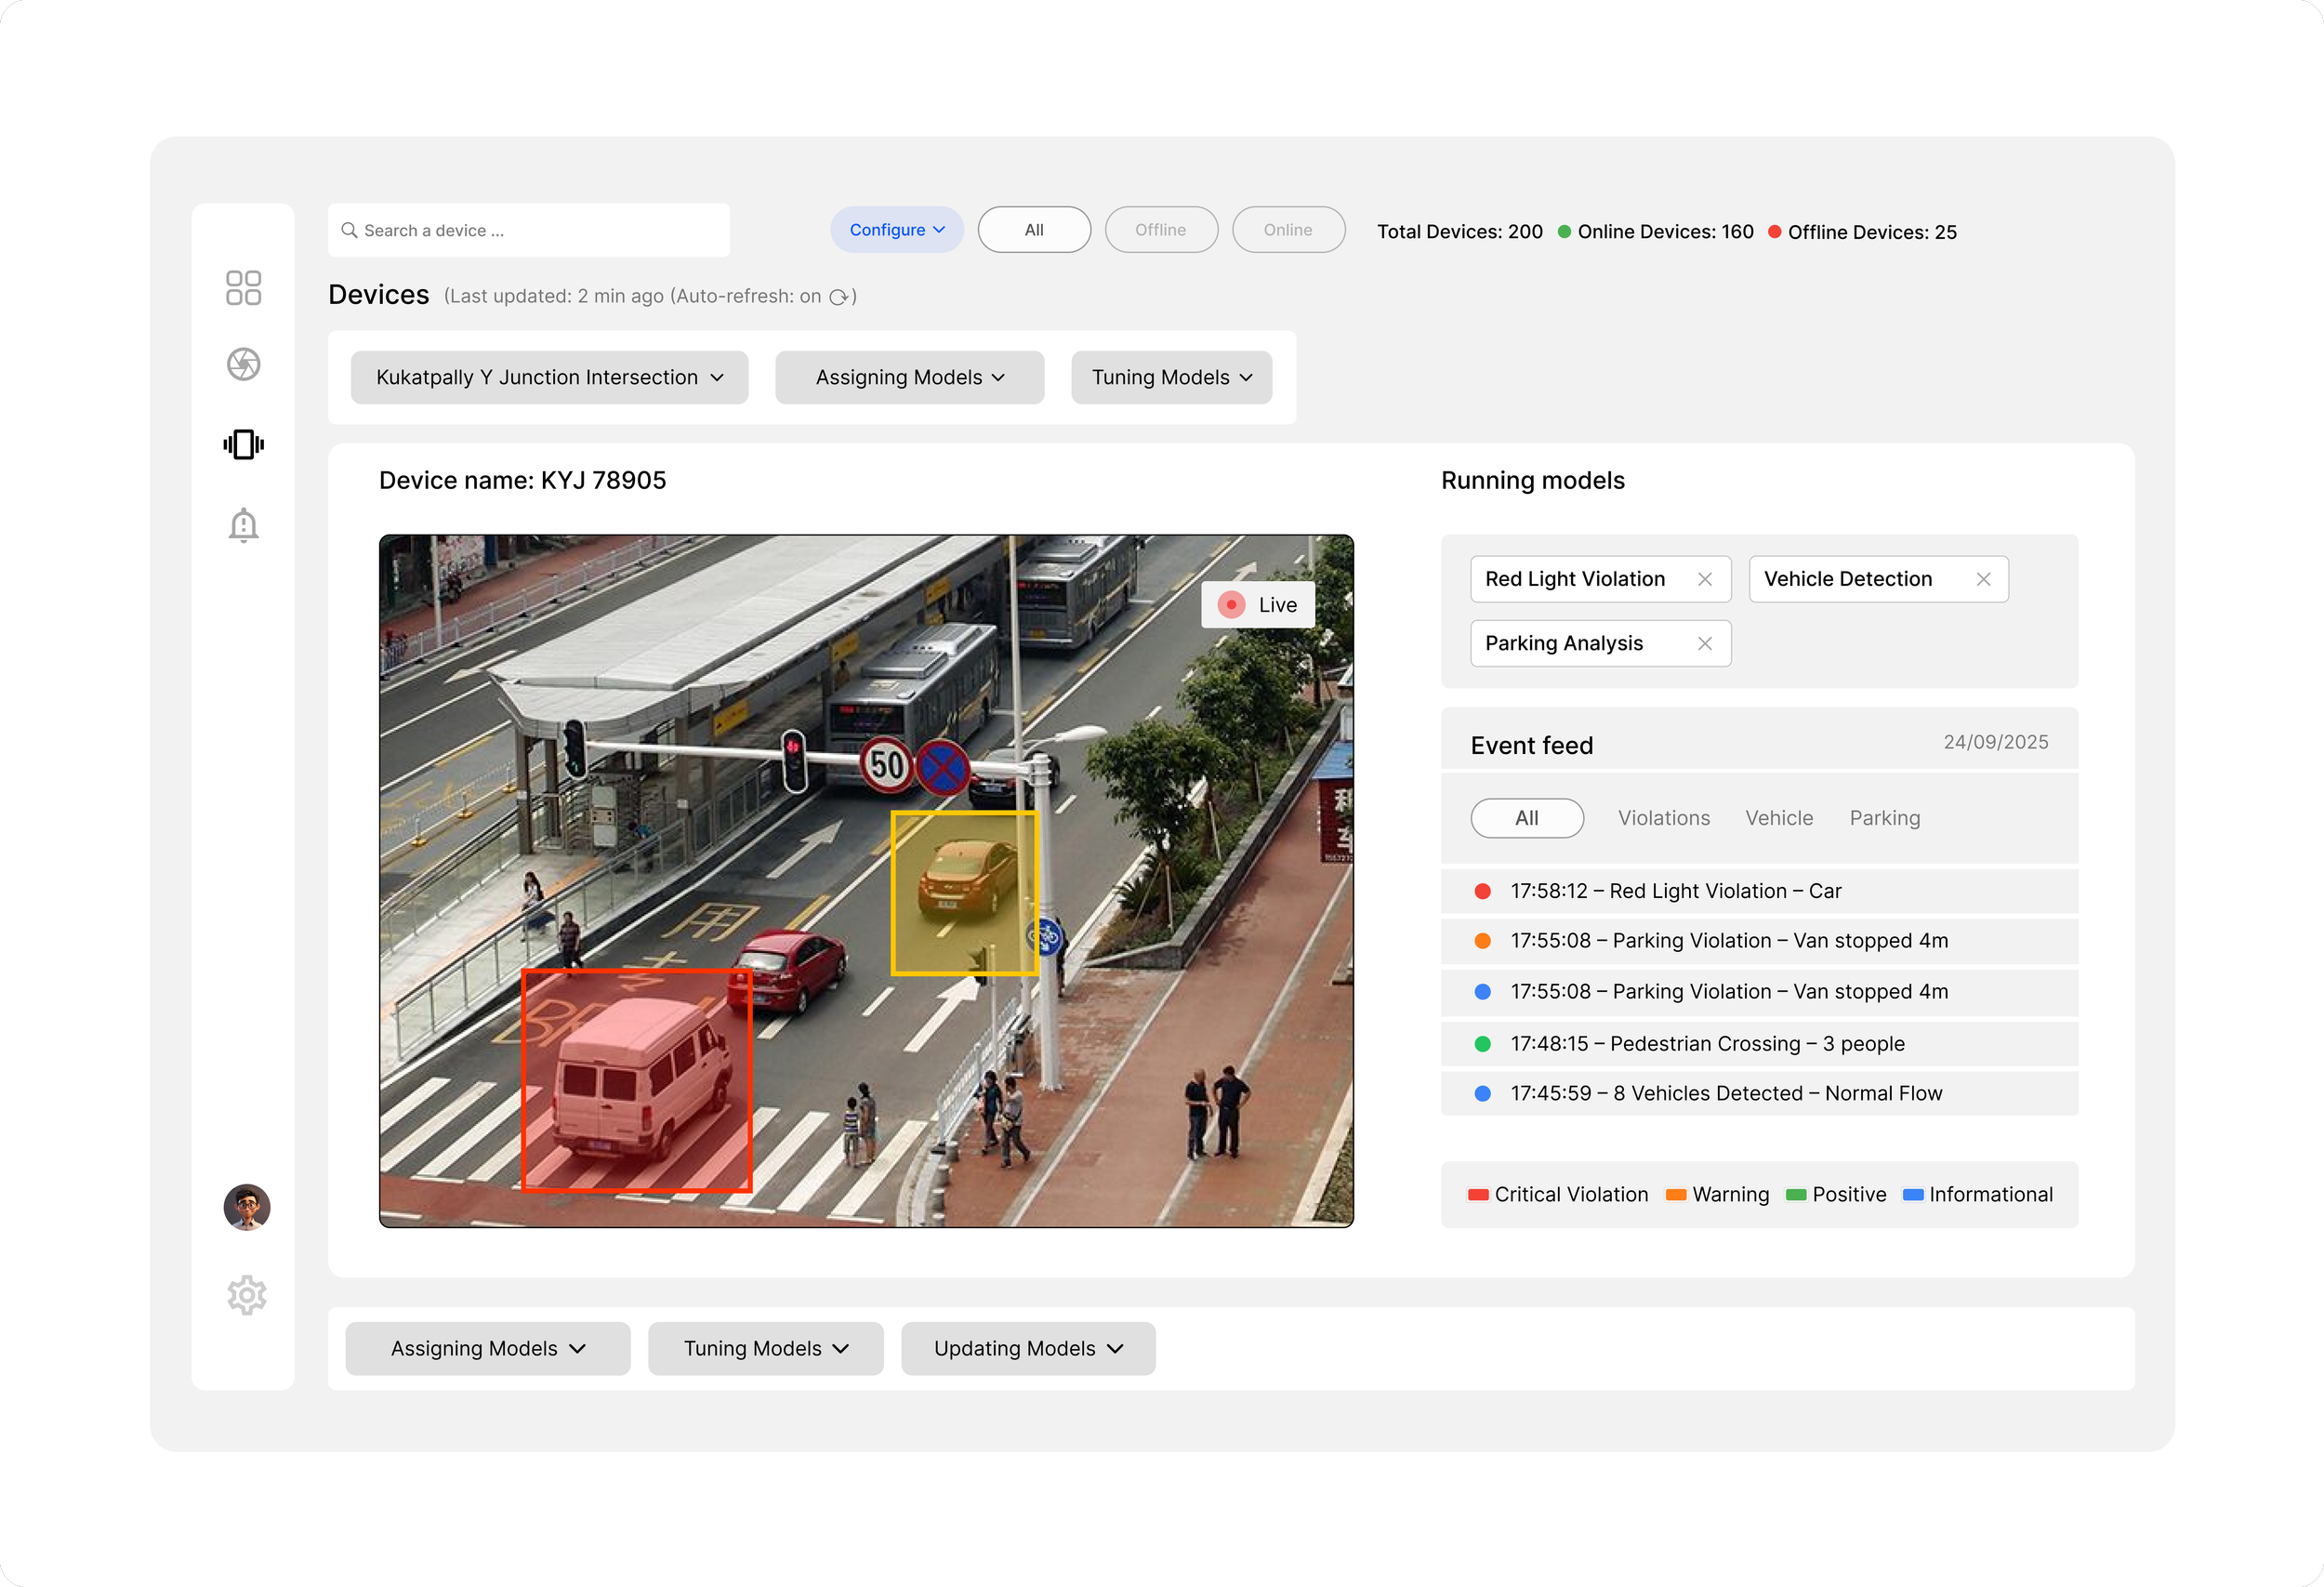
Models can be assigned, tuned, or updated
Real-time events show model output
Actions are separated from monitoring to reduce risk
Live camera view shows what the device sees
Detections are highlighted for quick validation
Active AI models are listed clearly
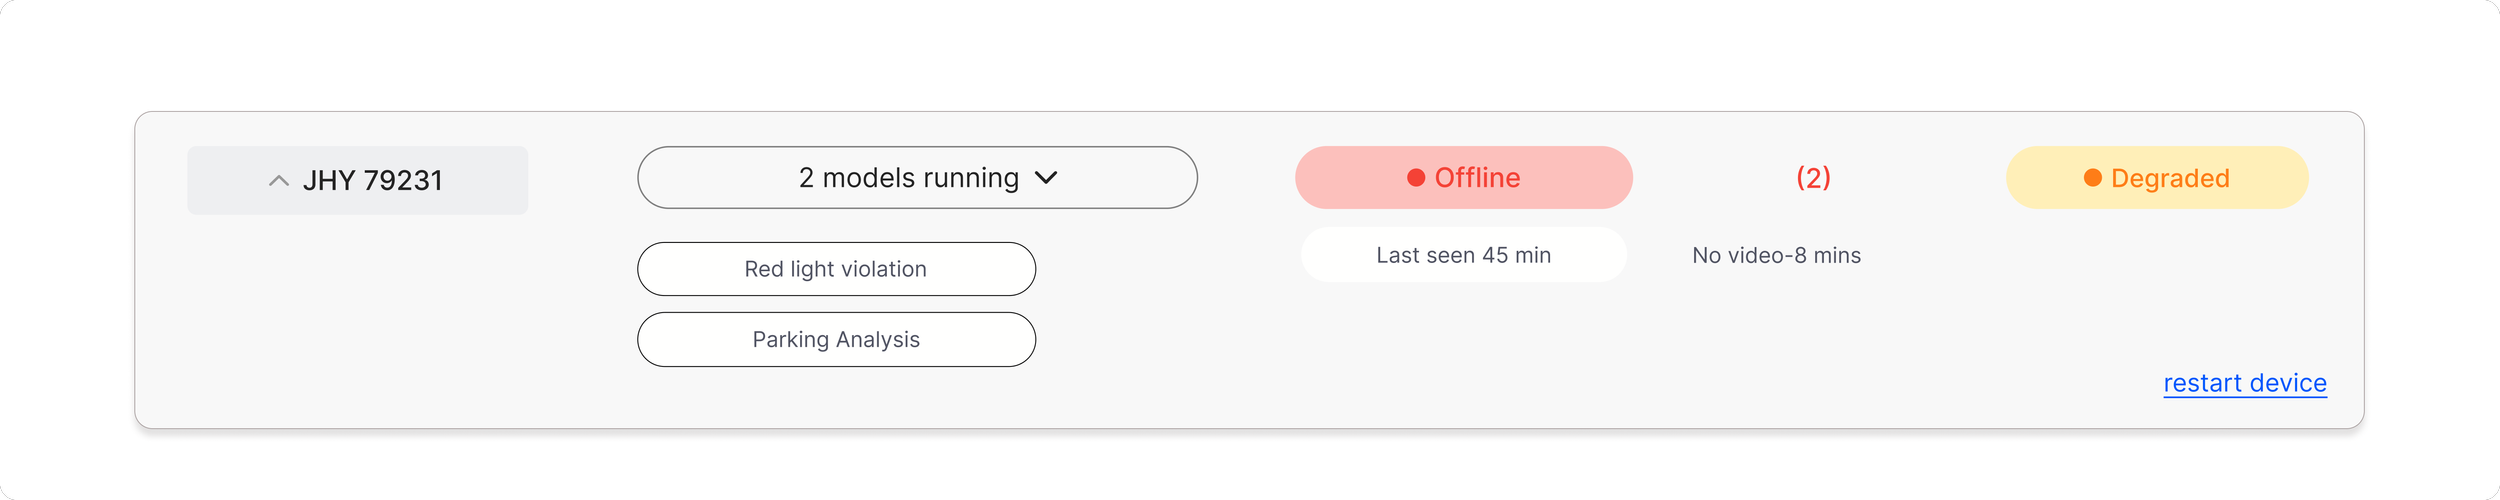
Opportunity 3: Improve how alerts guide users from awareness to resolution
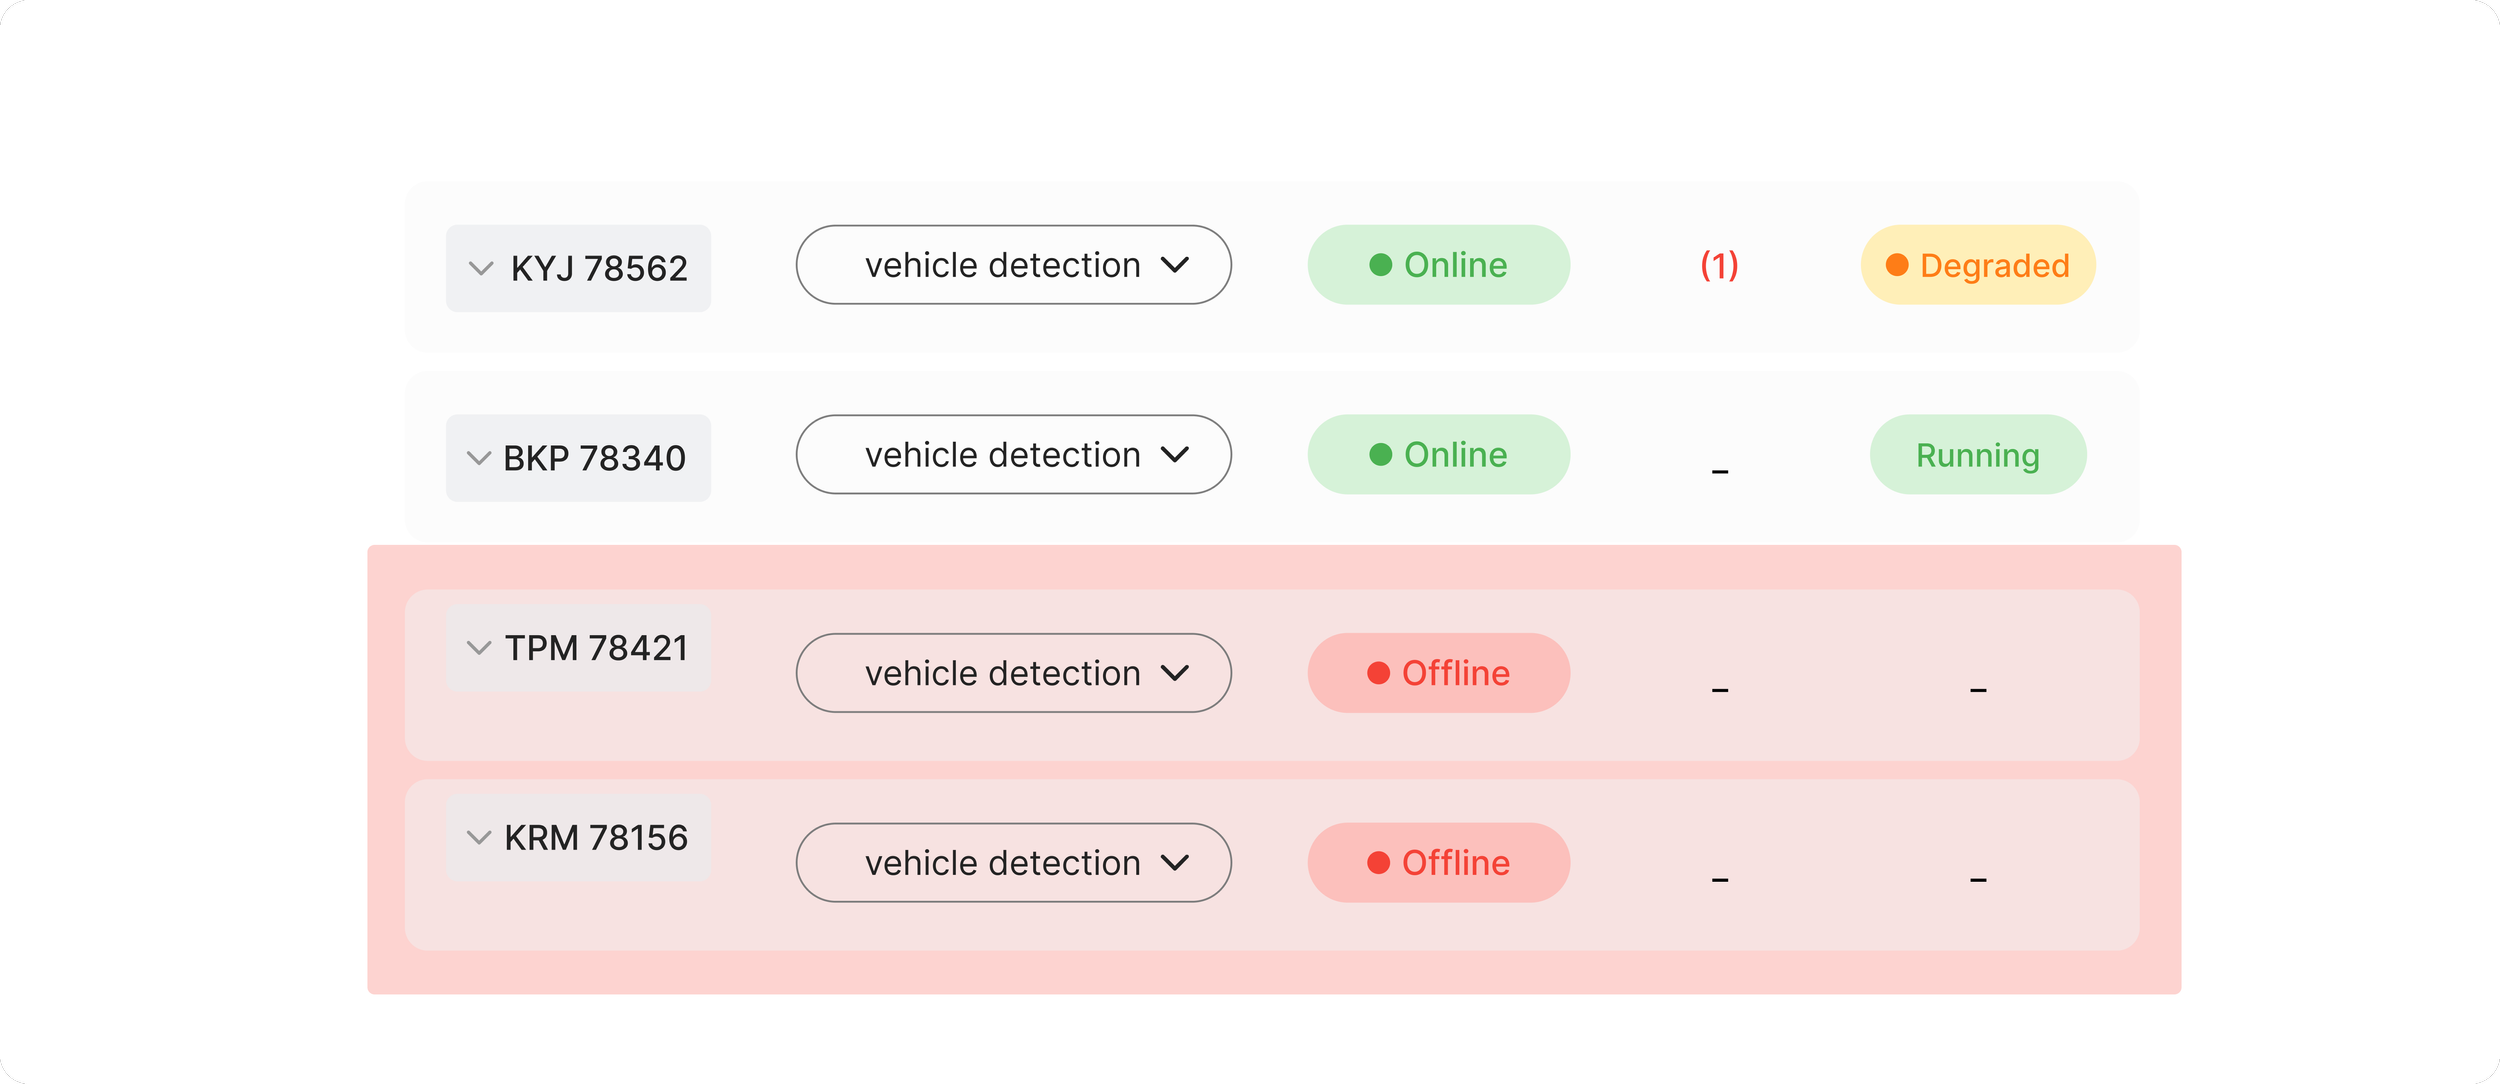
Quick status tags showing device health, activity, and alerts at a glance
Alerts help operators quickly identify problems and understand their impact. Each alert provides context, affected devices, and clear actions to resolve the issue.
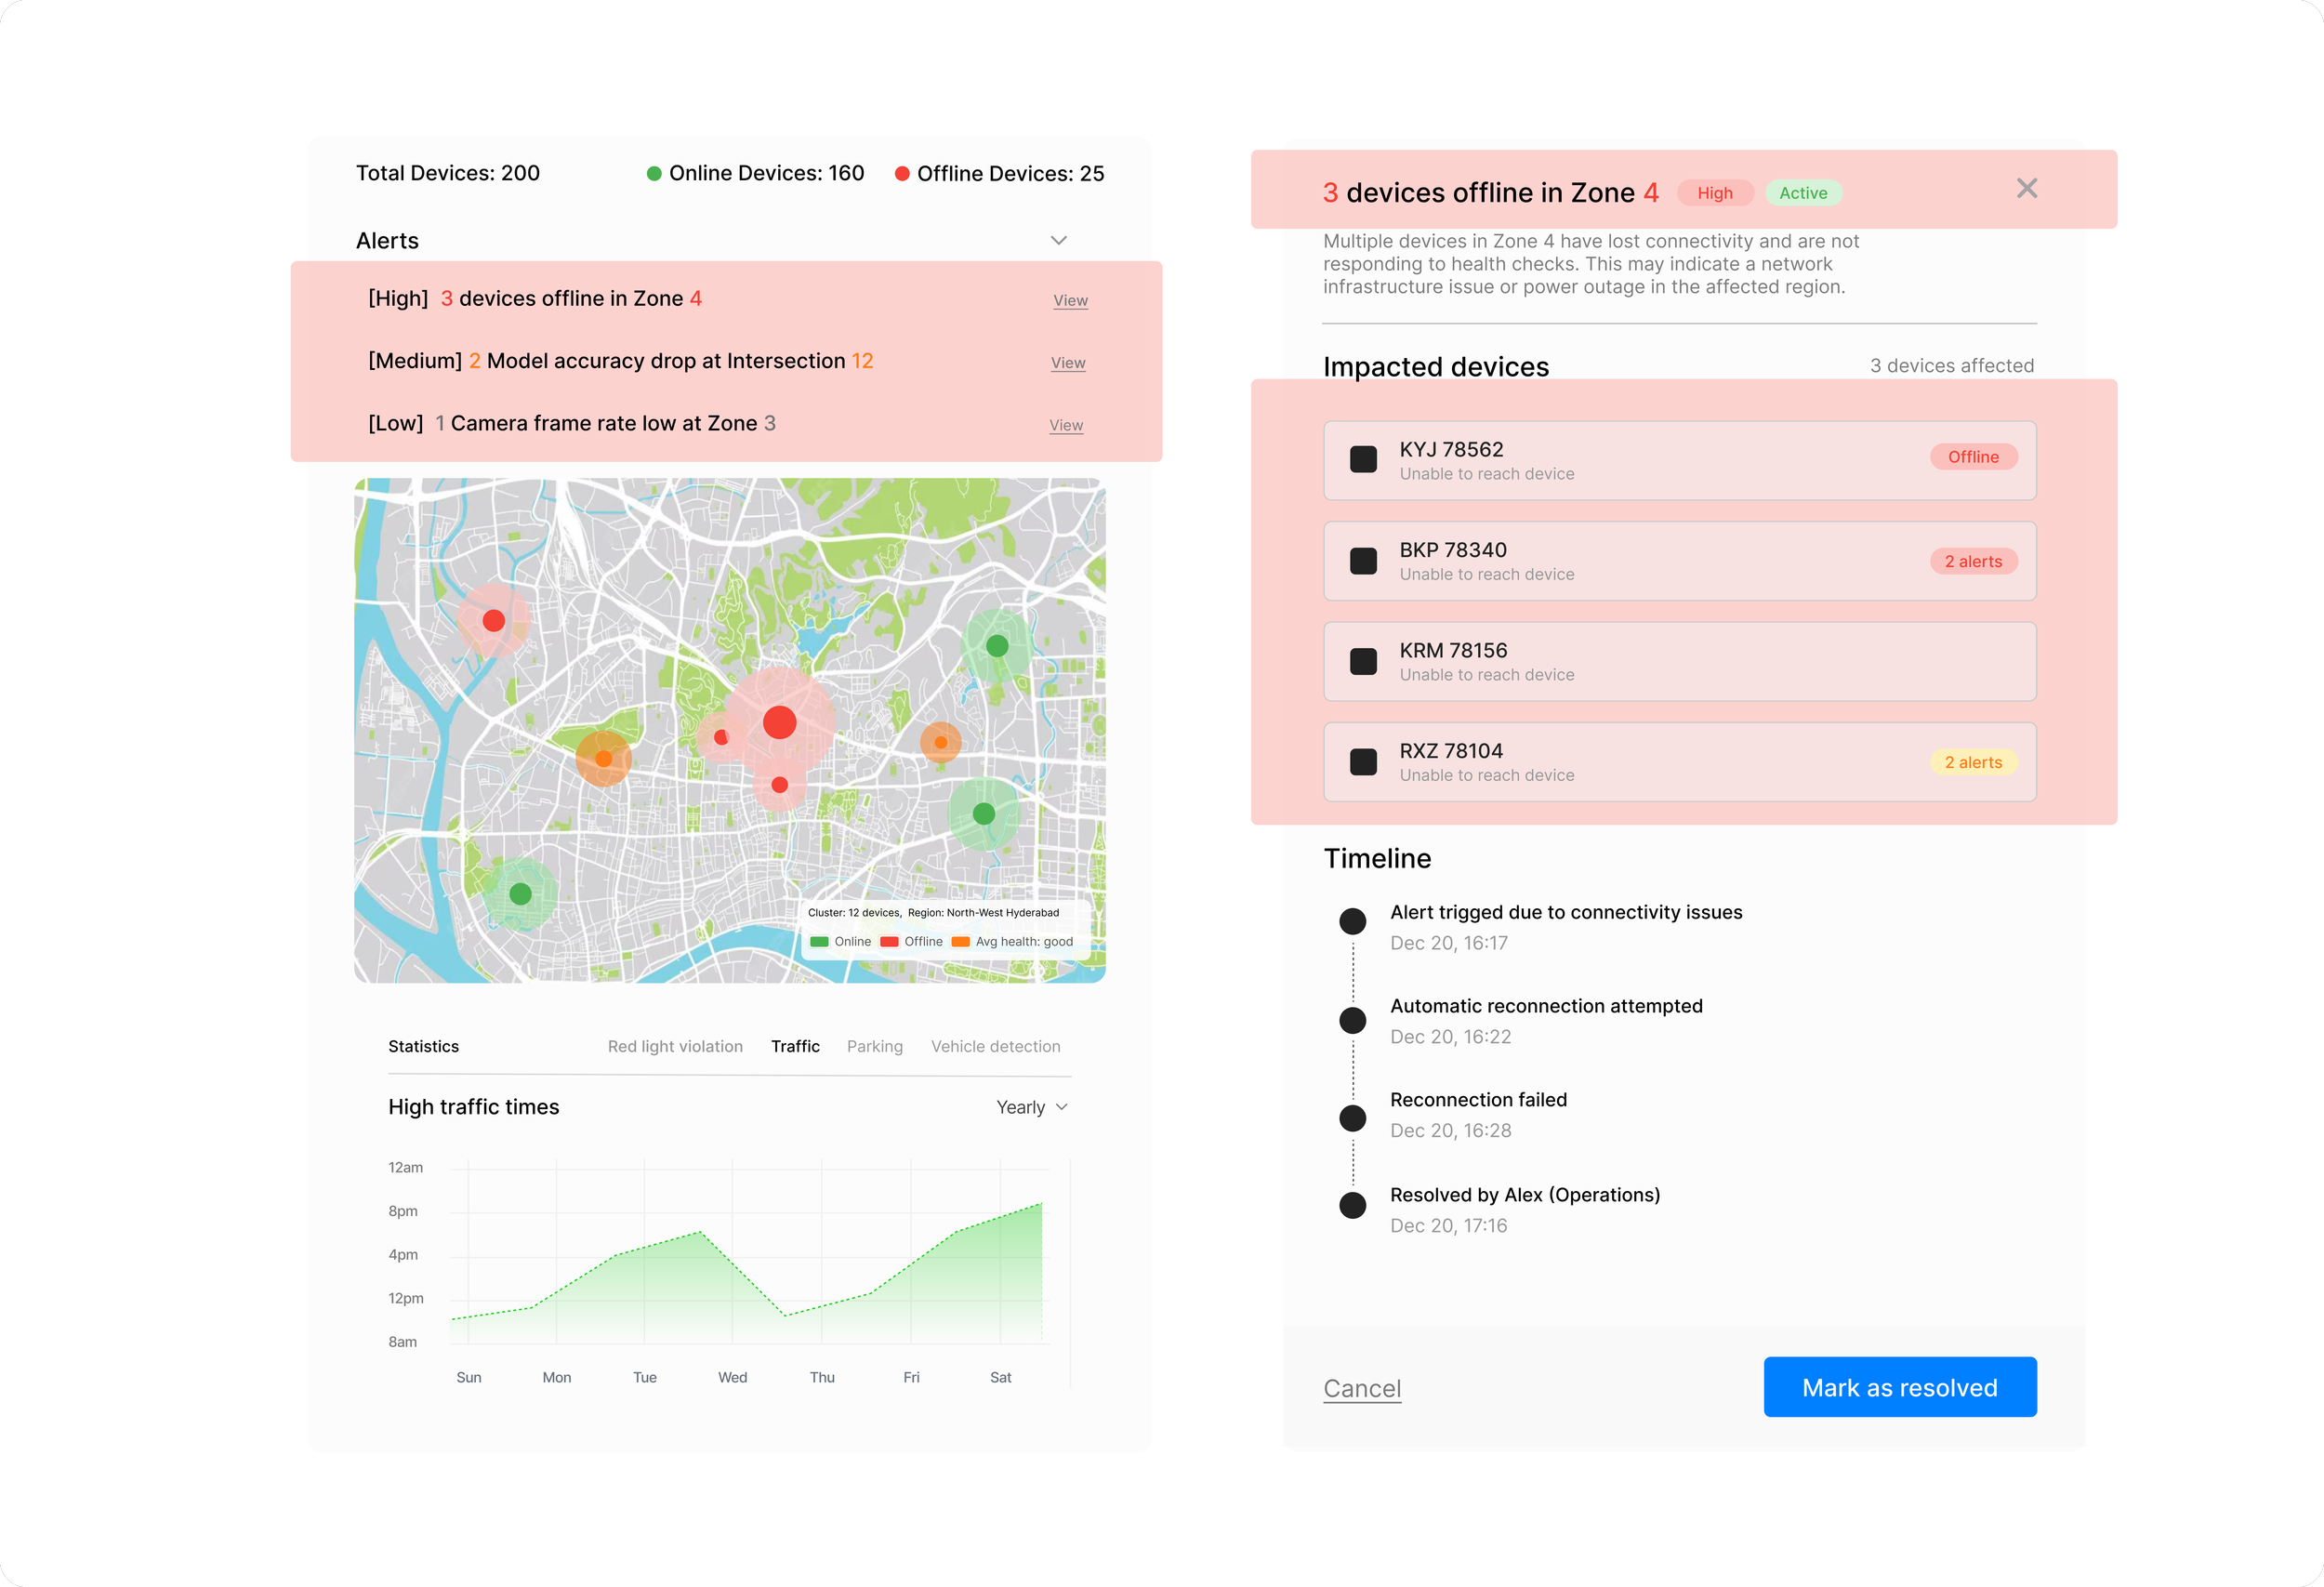
Operators can review what happened, see which devices are affected, and take action to resolve the issue from one place.
Map
Map view to show which areas are working well and which need attention.
Learning's & takeaways
01
Clarity matters more than adding features
02
Guide users through decisions instead of exposing raw system data
03
Alerts should guide decisions, not just notify problems